Using Data Dashboards on Large Screens: Best Practices
Discover effective strategies for displaying data dashboards on large screens with optimal layouts, visualization techniques, and TelemetryOS integration.
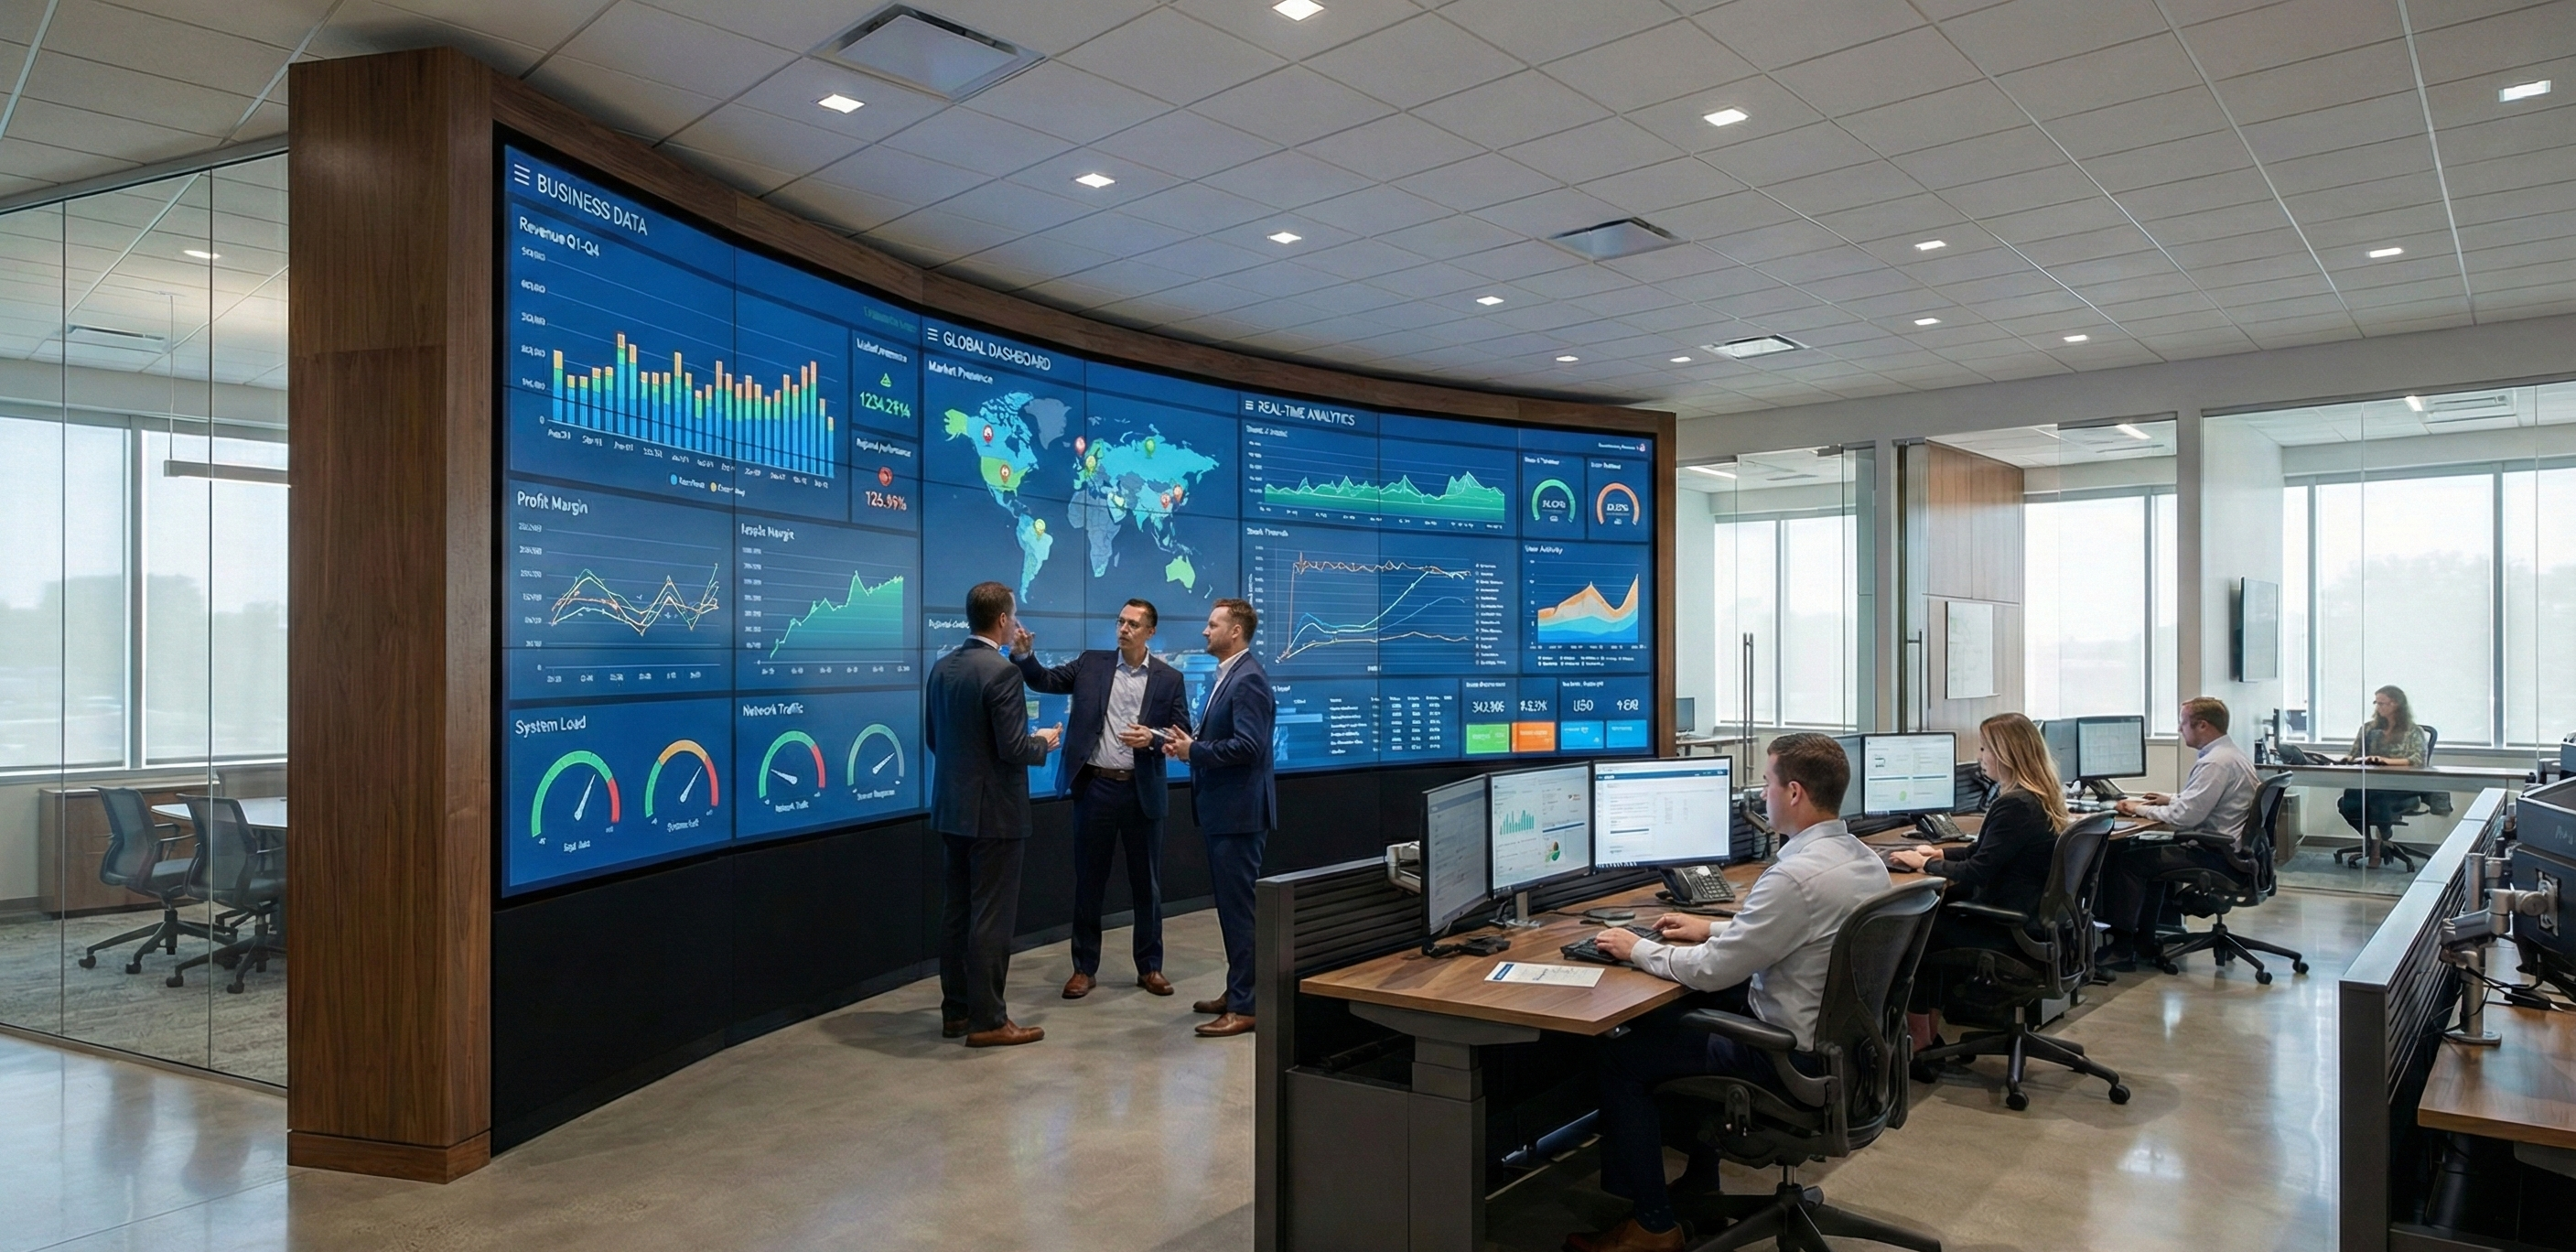
When your team needs to monitor critical business metrics on large displays, effective dashboard design ensures information clarity and actionable insights at a glance.
Using Data Dashboards on Large Screens: Best Practices
A manufacturing floor displays real-time production metrics on a 65-inch screen visible from 30 feet away. Operators glance at the dashboard throughout their shifts to check whether current output is tracking to target, whether quality metrics are within spec, and whether equipment issues require attention. That dashboard succeeds when operators can read key metrics in under three seconds from normal working distances, and fails when they need to walk up to the screen and squint at tiny fonts to extract the information they need.
Large screen dashboards change how teams access business intelligence by making data continuously visible rather than buried in reports that require active searching. But design principles that work for desktop monitors fail on displays viewed from 10-20 feet away by people doing other tasks. Text sizing, color choices, information density, and layout hierarchy all require different approaches when the viewing context changes from dedicated desk work to ambient monitoring in shared spaces.
Design Principles for Distance Viewing
Typography requirements change dramatically when viewing distance increases from the 2-3 feet typical for desktop monitors to the 10-20 feet common for conference room and operations floor displays. Minimum readable font sizes increase proportionally. What works at 12 points on a desktop requires 36+ points on a large screen display 15 feet away. Headers need 48-72 point sizing to establish clear visual hierarchy. Organizations often underestimate this scaling requirement, creating dashboards that look perfect during desktop design but become illegible when deployed to actual viewing contexts.
Color contrast becomes more important as viewing distance increases. Subtle color variations that distinguish data series on desktop displays wash out when viewed across rooms. Bold, saturated colors with high contrast ratios keep different data series visually distinct from typical viewing distances. Pastels and low-saturation hues that appear sophisticated on desktop monitors fail to communicate effectively on large displays where ambient lighting and viewing angles reduce perceived color differences.
Information density must decrease compared to desktop dashboards. A desktop business intelligence tool might display 20-30 metrics simultaneously, allowing users to zoom, scroll, and explore data through active interaction. Large screen dashboards viewed from distance should show 4-8 primary metrics maximum, with clear visual hierarchy establishing what matters most. When too much information competes for attention, viewers can't quickly extract the insights that large displays should provide. Less information, presented larger and clearer, communicates more effectively than comprehensive data dumps that become overwhelming.
Visual hierarchy guides viewer attention through deliberate sizing, positioning, and color choices. Primary metrics, the numbers that matter most right now, should dominate screen space through large text, bold colors, and prominent positioning. Secondary information provides context but should remain visually subordinate so viewers know where to look first. When everything on screen receives equal visual weight, nothing captures attention and the dashboard fails as an at-a-glance information system.
Layout and Information Organization
Zone-based organization divides screen space into logical sections that serve different information purposes. Primary zones display current status and metrics that require immediate attention. Secondary zones show trend data and historical context that help viewers understand whether current performance is typical or unusual. Tertiary zones provide detailed breakdowns or supporting information that viewers reference when primary metrics indicate issues requiring deeper investigation. This spatial organization creates predictable layouts where viewers learn to find specific information types quickly.
Progressive disclosure presents summary information prominently while keeping supporting detail available but visually subordinate. A manufacturing dashboard shows current hourly production rate in large numbers, with smaller trend lines showing the last 8 hours of performance and even smaller text showing shift targets. This layered approach gives viewers the headline metric instantly while providing context for those who need it. All information remains visible without any interaction required, but visual prominence matches importance.
Consistent positioning for common elements reduces the cognitive effort required to extract information. Timestamps, alert status indicators, and primary KPIs should occupy predictable locations across different dashboards within an organization. When sales, operations, and facilities dashboards all place time indicators and status alerts in the same screen locations, viewers develop spatial memory that accelerates information extraction. Standardization helps more than visual creativity in operational dashboard contexts where speed of comprehension matters more than aesthetic novelty.
Visualization Techniques for Large Displays
Chart types must be selected for distance readability rather than comprehensive data representation. Bar charts and column charts communicate comparisons clearly from distance through bold shapes and strong color coding. Adequate spacing between bars keeps them visually distinct. Line graphs show trends effectively but require thick lines (3-5 pixels minimum) and clear data point markers to maintain visibility. Multiple data series need distinctly different colors that remain distinguishable across the room, not subtle variations that blend together at distance.
Gauge and meter visualizations provide intuitive status indication for single metrics but require large sizing to remain readable. A gauge showing production efficiency makes sense at 15-20% of screen height, but becomes illegible when sized to accommodate six gauges on one screen. Color coding helps interpretation, with consistent color schemes across all gauges establishing visual language for status levels. Green for good, yellow for caution, red for critical. Simple conventions that viewers understand instantly without needing to read labels or legends.
Heat maps can show patterns across large data sets but require careful color selection and adequate cell sizing. If individual cells are too small to distinguish from typical viewing distances, the heat map fails. Clear legends and value ranges help viewers interpret colors without close examination. For heat maps to work on large displays, each cell needs sufficient size to remain individually visible, which often means showing less data than desktop versions that allow zooming and hovering for details.
Sparklines provide compact trend visualization but must be sized appropriately for large screen viewing. A sparkline that works well in a desktop table row at 20 pixels high needs 60-80 pixels on a large display viewed from distance. Scaling isn't linear. As display size increases, individual elements need proportionally greater sizing to remain legible. What looks absurdly large during desktop design often proves barely adequate when deployed to actual viewing contexts.
From Data Source to Display
The practical challenge with large screen dashboards isn't visualization design. It's plumbing. Most organizations need to pull metrics from multiple systems (ERP, CRM, manufacturing equipment, BI tools) and consolidate them into a single view. That data aggregation layer determines whether the dashboard shows a unified operational picture or just replicates the fragmentation of checking separate systems on a bigger screen.
Rendering performance matters more than you'd expect. Choppy animations, laggy updates, or visual glitches on a screen visible to an entire team undermine confidence in the data itself. People start wondering if the numbers are stale. Smooth, consistent rendering is table stakes for dashboards that teams actually trust. Platforms like TelemetryOS handle rendering optimization and remote configuration updates, which makes a practical difference when you're managing dashboards across dozens of locations and can't send a technician every time a data source changes.
Where Dashboards Create Real Value
The strongest dashboard use cases share a pattern: information that was previously siloed in specialist systems becomes visible to everyone who needs it, in real time.
On a manufacturing floor, operators glance at production rate, quality, and equipment status without leaving their stations. When a line drifts off target, everyone sees it simultaneously, and coordinated response happens faster than if one person noticed an alert in a monitoring app and had to call colleagues. The dashboard doesn't just display data. It creates shared situational awareness that changes how teams respond.
Healthcare shows a similar dynamic. A centralized display in an ED showing bed availability, expected discharge times, and incoming patient flow lets care coordinators place patients efficiently. Before the dashboard, this required a series of phone calls to individual units. After, the information is ambient. Anyone walking past can see current capacity. The workflow change is less about technology and more about eliminating information bottlenecks.
Financial services trading floors were early adopters for obvious reasons: when market conditions change, everyone needs to see it simultaneously. The same principle applies anywhere decisions depend on rapidly changing data visible to multiple people at once.
When Dashboards Don't Work
Dashboard fatigue is real. The initial excitement of seeing live metrics on a big screen fades within weeks if the information doesn't connect to daily decisions. A sales leaderboard that nobody can affect during their shift becomes wallpaper. A dashboard showing metrics that update once daily doesn't need a live display; a morning email would serve the same purpose at lower cost.
The maintenance burden catches organizations off guard. Data sources change APIs. Business units reorganize. KPIs get redefined quarterly. A dashboard that isn't actively maintained becomes inaccurate, and an inaccurate dashboard is worse than no dashboard because it erodes trust in data-driven decision making across the organization. Teams need to budget ongoing development time, not just initial build effort.
Some information simply works better in other formats. Complex analysis requiring drill-down belongs on desktops where users can interact with it. Historical trend analysis spanning months or years needs more screen real estate than a shared display provides. Dashboards excel at current-state awareness for metrics that change throughout the day. When the use case doesn't match that pattern, simpler approaches (automated reports, alert notifications, periodic briefings) often work better with less infrastructure.
Making Dashboards Operational
Large screen data dashboards succeed when they turn business intelligence from individual activity into shared awareness. The technical capability to aggregate data and render it on large displays is necessary, but not sufficient. Effective dashboards require understanding what information viewers need, how they'll use it, and what viewing conditions they'll experience. Design decisions about typography, color, layout, and visualization types determine whether dashboards provide actionable intelligence or simply occupy screen real estate.
The value comes from thoughtful information design that respects viewing distance, cognitive limits, and operational context. Organizations that treat dashboard deployment as an information design challenge rather than just a technology implementation create systems that teams actually use. The ones that treat it as a technology project end up with expensive screens showing data nobody looks at.
See TelemetryOS in Action
Explore how leading companies transform their screens