IoT Sensors + Digital Signage for Smarter Spaces
Discover how IoT sensor integration creates responsive digital signage that adapts to environmental conditions using TelemetryOS.
When your digital signage needs to respond to real-world conditions like temperature, occupancy, or air quality, IoT sensor integration creates intelligent environments that enhance user experience and operational efficiency.
Integrating IoT Sensors with Digital Signage for Smarter Spaces
Most digital signage operates blind to its surroundings. Displays run scheduled content loops whether the hallway is packed with rushing commuters or completely empty at 3 AM. Meeting room signs show "occupied" for two hours while the room sits vacant because the scheduled meeting ended early. Air quality alerts post during normal conditions while actual poor air quality goes unannounced because no one updated the content. This disconnect between physical reality and digital content creates inefficiency at best and actively misleading information at worst.
The fundamental problem is that traditional signage systems lack awareness of physical context. They follow time-based schedules and manual content updates that cannot respond to actual conditions. Occupancy sensors reveal when spaces are crowded or empty, enabling content strategies that adjust messaging complexity based on audience size and attention availability. Environmental sensors monitor temperature, air quality, and lighting conditions, providing data that both displays as information and influences content decisions. This sensor-driven intelligence creates spaces where digital signage responds to physical context rather than following predetermined schedules oblivious to actual conditions.
The value goes beyond novelty to operational utility. In healthcare facilities, occupancy sensors trigger queue management displays showing current wait times based on actual patient counts rather than estimates. Air quality monitoring provides real-time health metrics that inform facilities management and reassure occupants during periods when environmental concerns are heightened. Corporate environments use sensor data to display meeting room availability that accounts for actual occupancy rather than calendar reservations alone, solving the common problem of rooms marked busy but actually empty. Retail spaces adapt promotional messaging based on crowd density: simplified messages during peak traffic, detailed information during quiet periods when customers have more attention to engage.
Sensor Types and Data Sources
Occupancy sensors detect human presence through passive infrared, ultrasonic, or computer vision technologies that identify when spaces contain people. This presence data enables content activation when audiences are available and power conservation when spaces are empty. Aggregated occupancy data reveals traffic patterns across facilities: which areas see highest utilization, when peak traffic occurs, how long people typically remain in specific zones. This intelligence informs both content strategy and facilities planning beyond immediate display activation.
Environmental sensors monitor temperature, humidity, air quality, and lighting conditions, providing data streams that can both display as information and trigger content responses. Air quality sensors measuring particulate matter, CO2, and volatile organic compounds become increasingly important as building occupants expect transparency about environmental conditions. Temperature and humidity monitoring supports facilities management while informing occupant comfort. Lighting sensors enable automatic brightness adjustment that maintains display visibility while conserving energy.
Proximity sensors using ultrasonic, infrared, or time-of-flight technologies detect how close people are to displays, enabling graduated responses that show preview content as people approach and full detail when they stop. This progressive disclosure matches information density to engagement level: passive viewers see highlights, engaged viewers receive complete information. The same sensing capability enables energy conservation by powering down displays when no one is near rather than running continuously regardless of audience presence.
Integration with building management systems provides access to operational data including HVAC status, elevator availability, security system states, and utility consumption. This operational intelligence enables wayfinding displays that account for elevator service disruptions, emergency communication that coordinates with security systems, and energy dashboards that combine sensor data with utility metering for comprehensive environmental performance visibility.
Occupancy-Based Content Optimization
Crowd density adaptation changes content complexity based on audience size and presumed attention availability. During peak traffic when hallways fill with people moving toward destinations, displays show simplified high-contrast messaging that communicates quickly. During quiet periods when individuals have time to stop and engage, displays present detailed information, complex data visualizations, or long-form content that requires sustained attention. This strategy maximizes communication effectiveness by matching content to available attention rather than displaying identical content regardless of context.
Queue management systems combine occupancy sensing with predictive modeling to provide accurate wait time estimates based on actual crowd size and historical processing rates. Healthcare facilities display estimated wait times for different departments, helping patients make informed decisions about when to arrive or whether to return later. Government service offices show current queue depth for different service types. The displays update continuously as conditions change, maintaining accuracy rather than displaying static estimates that quickly become wrong.
Meeting room availability displays integrate occupancy sensors with calendar systems to show accurate availability that accounts for both scheduled reservations and actual usage. Sensors detect when rooms reserved but unused are actually available for impromptu meetings, solving the frustrating problem of unavailable conference space while empty rooms remain locked because calendar systems show them as busy. When scheduled meetings end early, sensors trigger availability updates immediately rather than waiting for scheduled end times. This real-time accuracy improves space utilization and reduces frustration from inaccurate availability information.
Environmental Response and Adaptive Content
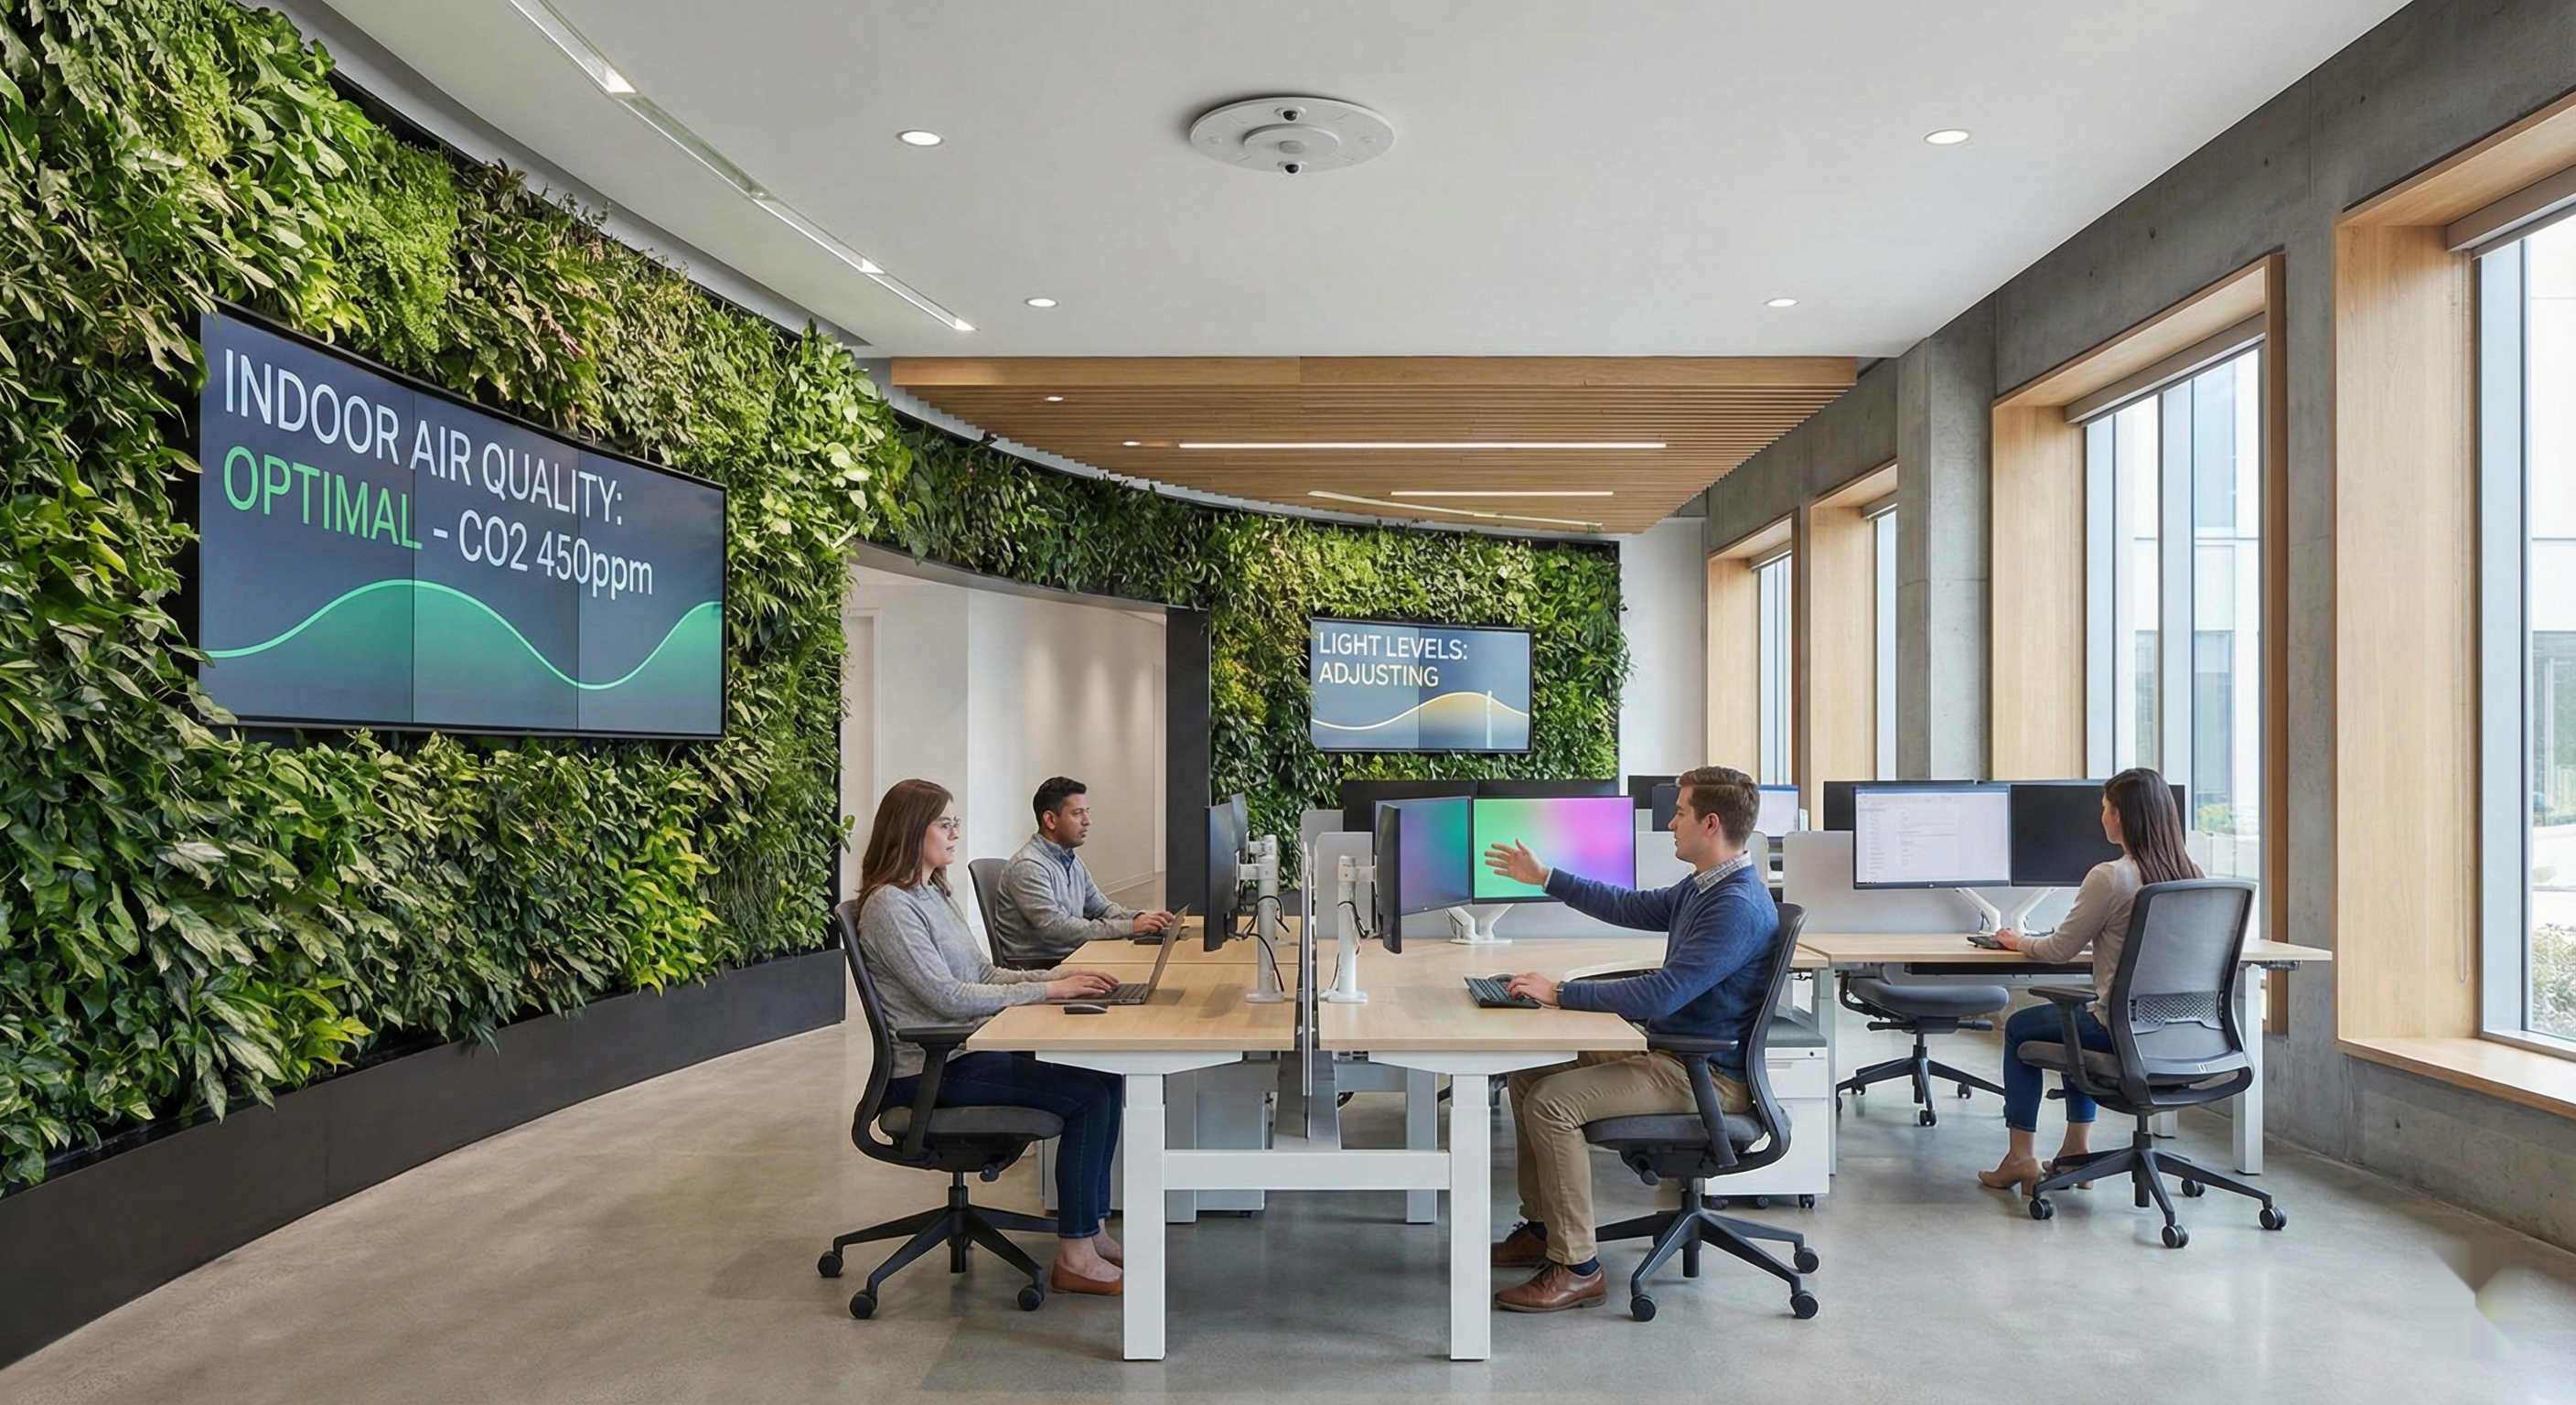
Air quality monitoring displays real-time data about particulate matter, CO2 levels, and volatile organic compounds, providing transparency about indoor environmental conditions. These displays serve both informational and operational purposes: occupants see current conditions, while facilities teams use the same data to trigger ventilation adjustments or alert cleaning teams when air quality degrades below acceptable thresholds. During periods when environmental concerns heighten due to external factors like wildfire smoke or construction activity, these displays provide reassurance when conditions are acceptable and actionable information when conditions require response.
Temperature and humidity monitoring informs content strategies that acknowledge current conditions. Seasonal promotions can trigger based on actual temperature rather than calendar dates. Retail displays promote hot weather products when sensors detect actual heat rather than waiting for arbitrary summer start dates. Facilities dashboards display environmental conditions alongside operational metrics, giving building managers comprehensive visibility into physical plant performance. In extreme weather, displays automatically show safety information and modified operational hours.
Lighting integration enables automatic brightness and color temperature adjustment based on ambient conditions and circadian rhythm considerations. Displays in spaces with significant natural light dim automatically as daylight increases, maintaining visibility without the energy waste and potential glare from running at full brightness unnecessarily. During evening hours, displays reduce brightness and shift toward warmer color temperatures that reduce eye strain and support natural circadian rhythms for occupants working extended hours.
Weather integration uses external sensors and weather service APIs to trigger contextually relevant content. Outdoor display brightness adjusts automatically based on direct sunlight to maintain visibility. Building entrance displays show severe weather warnings when conditions warrant. Wayfinding content accounts for outdoor routes that might be unpleasant during rain or extreme temperatures. Retail displays promote weather-appropriate products: umbrellas during rain, cold weather gear when temperatures drop.
Platform Integration Architecture
Effective IoT-signage integration requires support for multiple communication protocols including MQTT for low-latency sensor data streaming, HTTP APIs for integration with building management systems and cloud services, and direct sensor integration for devices that connect locally to media players. This flexible connectivity accommodates diverse sensor types and existing building infrastructure without forcing standardization on a single protocol or vendor ecosystem. TelemetryOS provides these integration capabilities through its edge computing architecture.
Real-time data processing ensures immediate content responses when conditions require urgent attention. Emergency alerts override normal programming within seconds of detection when integrated fire alarms, security systems, or severe weather monitoring trigger critical notifications. Gradual environmental changes trigger smooth content transitions rather than jarring updates. Temperature-triggered content doesn't flip between hot and cold messaging on minor fluctuations but transitions at meaningful threshold crossings with appropriate hysteresis.
Edge computing enables local data processing that reduces latency for time-critical responses and provides resilience against connectivity disruptions. Media players with integrated IoT capabilities can process sensor data streams locally, making content decisions without round-trip communication to cloud management systems. This ensures displays respond immediately to occupancy and environmental changes even during network disruptions that might temporarily prevent communication with central management platforms.
Data analytics and reporting aggregate sensor information over time to identify patterns that inform content strategy optimization. Historical occupancy data reveals peak utilization periods by location, day of week, and time of day, enabling scheduling decisions based on actual traffic patterns rather than assumptions. Environmental trend analysis identifies seasonal patterns and facility areas with persistent environmental issues requiring attention. Usage reports demonstrate the business value of sensor-driven content by quantifying engagement improvements and operational efficiencies gained from intelligent display behavior.
Tradeoffs and Limitations
IoT-signage integration introduces complexity that organizations should weigh against expected benefits. Every sensor added to a deployment becomes another potential point of failure. A malfunctioning occupancy sensor might leave displays dark when spaces are actually occupied, or faulty air quality readings might trigger false alarms that erode trust in the system. Maintenance burden increases with sensor count, and troubleshooting content issues becomes harder when display behavior depends on external data sources that might be providing incorrect readings.
Integration reliability varies significantly across sensor vendors and protocols. MQTT connections can drop silently, HTTP APIs can timeout during peak load, and building management system integrations often require custom middleware that becomes a maintenance liability when either system updates. Organizations should expect to invest in monitoring infrastructure that alerts when sensor data stops flowing, not just when displays malfunction.
The business case for sensor integration weakens considerably for smaller deployments. The complexity overhead of managing sensor infrastructure, maintaining integrations, and troubleshooting data-driven content issues might not justify benefits for organizations with fewer than 20-30 displays. Simpler time-based scheduling with manual overrides often delivers adequate results with significantly less operational burden. Not every deployment needs real-time environmental response.
Privacy and security concerns also warrant honest assessment. Occupancy sensors that provide genuinely useful data often capture more than simple presence/absence. They might track movement patterns, dwell times, or crowd flows in ways that make employees or customers uncomfortable. Organizations should evaluate whether the operational benefits justify the surveillance footprint, and be prepared to limit sensor capabilities or anonymize data in ways that reduce analytical value.
Implementation Strategies and Privacy Considerations
Site surveys identify optimal sensor locations that provide accurate environmental monitoring while minimizing installation complexity and maintenance access challenges. Sensor placement significantly affects data quality: occupancy sensors must have clear views of monitored spaces, environmental sensors should avoid locations with localized conditions unrepresentative of general areas, proximity sensors require mounting positions that detect approaches from expected traffic patterns. Professional site surveys prevent deployment of sensors in locations that produce misleading data requiring later repositioning.
Network architecture planning ensures adequate bandwidth and reliability for sensor data transmission while maintaining security boundaries between IoT devices and critical business systems. Dedicated IoT networks isolate sensor traffic from business systems, preventing compromised sensors from becoming attack vectors into corporate networks. This segmentation enables different security policies appropriate to the lower trust level of IoT devices compared to managed business systems. Wireless connectivity simplifies sensor deployment in existing facilities where running cables would be disruptive or cost-prohibitive.
Privacy considerations require careful attention when deploying sensors that might capture personal information or behavior patterns. Occupancy counting sensors that measure space utilization without identifying individuals provide useful data while respecting privacy. Computer vision systems that track individuals or capture faces require explicit consent management and data governance policies that define retention limits and access controls. Anonymous aggregation techniques enable useful insights about traffic patterns and space utilization without creating detailed surveillance records of individual movements.
Security implementation for IoT systems includes encryption for all data transmission and storage, access controls limiting data visibility to authorized personnel, and audit logging that tracks who accessed sensor data and for what purposes. Organizations should implement data governance policies appropriate to their industry and regulatory requirements. For healthcare deployments, HIPAA compliance requires additional security controls when sensors monitor areas where patient information might be captured.
Operational Benefits and When They Apply
Energy conservation from occupancy-based display activation reduces operational costs while supporting sustainability goals. Displays that power down automatically when no audience is present can reduce energy consumption by 40-60% compared to continuous operation, with savings compounding across large deployments running 24/7. This automated power management eliminates the operational burden of manual scheduling while achieving energy reductions that manual approaches rarely sustain consistently.
Space utilization improvements from accurate occupancy data enable better facilities planning and resource allocation. Organizations discover which conference rooms see highest utilization and which remain underused despite similar size and equipment. Traffic pattern analysis reveals inefficient layouts where high-traffic areas create congestion while nearby spaces remain empty. This intelligence supports decisions about space reallocation, expansion planning, and facility design optimization that improve both operational efficiency and occupant experience.
Contextually appropriate content improves communication effectiveness and occupant satisfaction. Content that adapts to actual conditions feels more relevant and helpful than static displays following predetermined schedules. Accurate wait time information, reliable room availability, and timely environmental alerts build trust that displays provide useful information worth consulting rather than becoming visual noise that occupants learn to ignore.
Creating Intelligent Responsive Environments
IoT sensor integration transforms digital signage from scheduled content displays into systems that respond to real-world conditions and deliver genuinely contextual information. The technology enables creating spaces where physical environment and digital information systems work together rather than operating independently with no awareness of each other. Organizations implementing sensor-driven signage gain both operational efficiencies from automated responses to changing conditions and communication effectiveness from content that adapts to actual audience context.
That said, sensor integration is not the right choice for every deployment. The complexity and maintenance burden should be weighed against actual operational needs. For organizations where the use case justifies it, platforms like TelemetryOS enable building these responsive applications through IoT integration support and real-time data processing capabilities. The question is not whether sensor integration is technically possible, but whether the benefits outweigh the added complexity for a specific deployment context.
See TelemetryOS in Action
Explore how leading companies transform their screens